|
Adding a Graph This page will outline some of the things that might help you as you first start including graphs in your documents. The links in this page bring you to more detailed descriptions of certain objects or procedures that are mentioned. You will create all your graphs within the Figure Editor. Figure editor toolbars and features are outlined in the Figure Editor Help Pages. To see some of the graphs it is possible to create look at our grids and graphs page. Here are some helpful hints and tips for when you are first starting to work with graphs. You will most likely want to create a grid to put your graph on. So first learn to create a grid in the figure editor on our Add a Grid page. 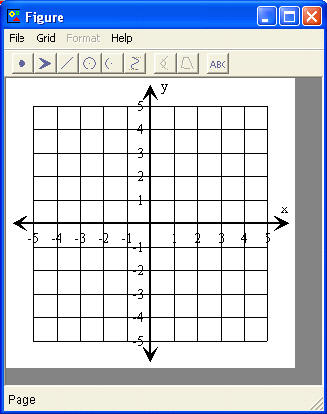 Start
with any grid you have added to your document. Double Click on the
grid and the Figure Editor will open up with your grid in it. Now you can
edit your grid and add graphs. Start
with any grid you have added to your document. Double Click on the
grid and the Figure Editor will open up with your grid in it. Now you can
edit your grid and add graphs.
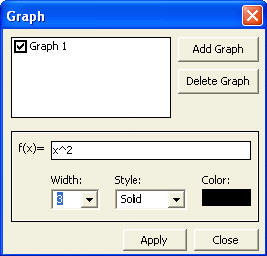
Add
as many graphs as you want to each grid and choose the thickness, color,
and style of each graph.
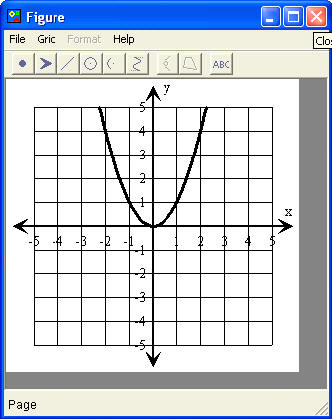
After
you have added all the graphs you want, click on the Close button and that
box will close and you return to the figure editor with your graphs now
drawn on your grid.
Add
the Graph you just created to your document. |
 You will need to open up the Graph editing box..